
Chapter 2(pp. 32-49) C431 Healthcare Research and Statistics
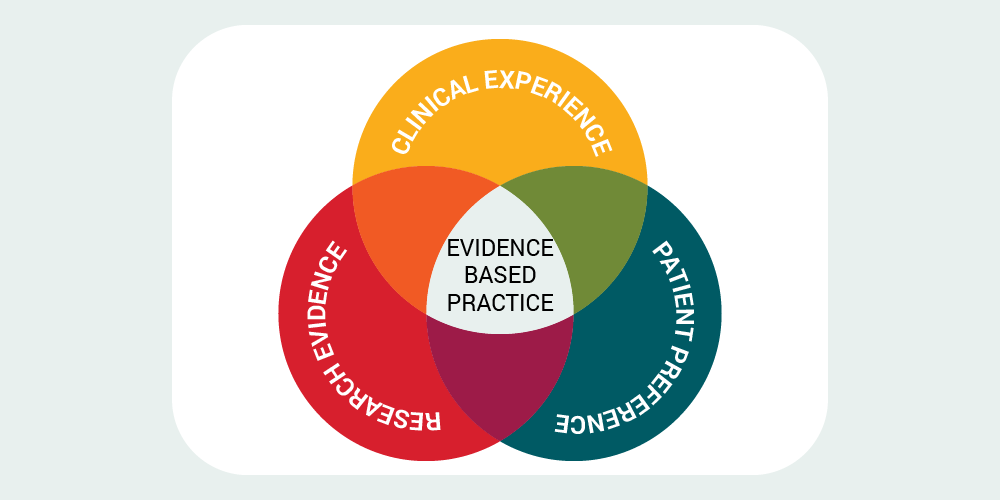
Topic 1: Evidence Based Practice
Research Paradigms
Table 2–1 Characteristics of Qualitative and Quantitative Research
Naturalistic/Qualitative Positivistic/Quantitative
Questions Open-ended Focused
Focus Lived experiences of individuals, groups, Causal relationships or statistical
or cultures that reveal meaning and significance of phenomena
Related: C431 Study Guide
Sampling Small, purposeful, and sometimes
differences that explain or predict phenomena, measuring effects of interventions
Large, preferably random samples blinded
emergent selection or serial selection of to the intervention participants
Setting Natural, uncontrolled; studied as part of Laboratory or controlled by design of
the research
Data Observation, artifact, textual, visual, field notes, audio recordings, includes data from researchers as well as participants
research
Numerical, measurable, objective data collected from subjects only
Reasoning Typically inductive, seeking descriptions Typically deductive, seeking predictions
Analysis Thematic, narrative, content-analytic
procedures
Descriptive and/or inferential statistics
Role of researcher
Active engagement with participants and phenomenon; researcher is one of many data sources within the study
No or minimal engagement with participants and phenomenon; subjects and instruments are the sources of data,
not researchers
Design Emergent, guided by data as study proceeds, utilizing no intervention
Fixed, predetermined, utilizing one or more interventions
Styles of Naturalistic Research
The most common styles include ethnography, biography, phenomenology, case study, and grounded theory. The definitions of each type are as follows:
- Ethnographyis a description and interpretation of a cultural or social group or system. The ethnographic researcher examines the group’s observable and learned patterns of behavior, customs, and ways of life. Ethnography involves prolonged observation of the group, typically through participant observation in which the researcher is immersed in the day-to-day lives of the people or through one-on-one interviews with members of the group.
- Biography is the study of an individual and her or his experiences as told to the researcher or found in documents and archival material.
- Phenomenologyis the study of the lived experiences of several individuals centered on a single phenomenon. A phenomenology is similar to a biography in its procedures, differing primarily in terms of the examination of a group as opposed to an individual.
- Case studyis an exploration of a bounded system (a case or multiple cases) over time through detailed, in-depth data collection involving multiple sources of information rich in context. The bounded system is bound by time and place such that the case or cases of interest may be an event, an activity, or the individuals themselves.
- Grounded theory is the study of abstract problems and their processes. It is a general methodology of analysis linked with data collection that uses a systematically applied set of methods to generate an inductive theory about a substantive area. The research product constitutes a theoretical formulation or integrated set of conceptual hypotheses about the substantive area under study.
Clinical Trial
The NIH divides clinical trials into five types of research questions (treatment, prevention, diagnosis, screening, and quality of life) and into four phases. The phases are defined as follows:20
- In Phase I trials, researchers test an experimental drug or treatment in a small group of people (20 to 80) for the first time to evaluate its safety, determine a safe dosage range, and identify side effects.
- In Phase II trials, the experimental study drug or treatment is given to a larger group of people (100 to 300) to see if it is effective and to further evaluate its safety.
- In Phase III trials, the experimental study drug or treatment is given to large groups of people (1,000 to 3,000) to confirm its effectiveness, monitor side effects, compare it to commonly used treatments, and collect information that will allow the experimental
drug or treatment to be used safely.
- In Phase IV trials, postmarketing studies delineate additional information, including the drug’s risks, benefits, and optimal use.
Table2–2Quantitative Styles of Biomedical Research:
Evidence hierarchy and styles of research
Topic 2: Statistical Methods
Crossing the Quality Chasm Six specific aims for improvement. These aims are built around the core need for health care to be:
- Safe: avoiding injuries to patients from the care that is intended to help them.
- Effective: providing services based on scientific knowledge to all who
could benefit and refraining from providing services to those not likely to benefit.
- Patient-centered: providing care that is respectful of and responsive to individual patient preferences, needs, and values, and ensuring that patient values
guide all clinical decisions.
- Timely: reducing waits and sometimes harmful delays for both those who receive and those who give care.
- Efficient: avoiding waste, including waste of equipment, supplies, ideas, and energy.
- Equitable: providing care that does not vary in quality because of personal characteristics such as gender, ethnicity, geographic location, and socioeconomic status.
Points to Remember
Healthcare managers rely on the information provided by statistics to make important administrative decisions.
- Identifying knowledge gaps: Statistics inform healthcare managersof knowledge or quality gaps to support identification of areas of weakness in an organization or community that need to be improved.
- Statistical literacy: Healthcare literacy not only refers to patients' comprehension of the healthcare system, but also applies to healthcare professionals. Statistical literacy, or the ability to apply and interpret statistical information to improve the quality of healthcare delivery, is an essential skill for healthcare managers.
An important distinction to consider when evaluating evidence-based practice is whether the statistics are descriptive or inferential.
Chapter 5 Box-and-Whisker Plots
Figure 5–20 Box-and-Whisker Plot
Figure 5–21 Box-and-Whisker Plot Showing the Interquartile Range
Icon Displays
Figure 5–24 Generic Icon Display
Figure 5–25 Cates Plot
Figure 5–27 Dot Plot of Ages in a Study with 1-year Increments per Column
Figure 5–28 Forest Plot
Figure 5–29 Survival Curve Example from the National Cancer Institute
Interval scale data have four characteristics:
- They are ordered, meaning each successive unit is higher or lower than the next.
- The distance between each unit is equal, meaning that each unit represents the same magnitude of the variable.
simply a point we have decided means zero.
- Values in an interval scale can be added and subtracted, but it does not make sense to multiply or divide them.
Chapter 6 Inferential Statistics
Figure 6–1 The Clinical Research Process
PARAMETRIC AND NONPARAMETRIC STATISTICAL TESTS
Parametric statistical tests are those that assume that the data meet all of the following criteria:
- Ratio or interval scale.
- Normal in shape (or nearly normal).
- Sufficient sample size.
- If there is more than one group, each group has the same (or nearly the same) amount of variability, the same shape, and the same (or nearly the same) sample size.
Nonparametric statistical tests assume that the data meet all of the following criteria:
- Nominal or ordinal scale.
- Non-normal shape (skewed).
- Small sample size.
- If there is more than one group, the groups have differing variability, shapes, or sample sizes.
Tests for Differences
Tests for differences can be used in three different ways:
- To compare independent groups
- To compare different points of time for the same subjects (referred to as pre/post, self- controlled, or correlated group design)
- To compare different areas of the body on the same subjects (referred to as within subject, self-controlled, or correlated group design)
ALPHA (PROBABILITY)
Levels of alpha:
α < 0.05 means that there is a less than a 5% chance that the test statistic represents normal variability. α < 0.01 means that there is a less than a 1% chance that the test statistic represents normal variability.
α < 0.001 means that there is a less than 0.1% chance that the test statistic represents normal variability.
Chapter 7
The Epidemiological Triad
Figure 7–1 The Epidemiological Triad of Disease
APPLICATIONS OF EPIDEMIOLOGY
The application of epidemiology to clinical care can be broadly classified into seven areas:
- Investigation of disease etiology
- Risk identification
- Identification of syndromes and disease classification
- Differential diagnoses and planning clinical treatment
- Effective surveillance of health status of populations
- Community diagnosis and the planning of health service
- Evaluation of health services and public healthinterventions
Chapter 9 Evidence-Based Practice in Treatment, Harm, and Prevention
Table 9–1 Characteristics of Treatment, Harm, and Prevention Studies
Type of StudyCharacteristics
Studies of treatment
Studies of harm
Studies of prevention
- Interventional, prospective studies with the purpose of treating a diagnosed condition (e.g., case studies, case series, control trials, randomized controlled trials [RCTs], cohort studies).
- Observational, prospective studies with the purpose of determining outcomes of patients with a diagnosed condition who are already receiving a specific treatment (e.g., cohort studies, systematic reviews, meta-analyses).
- Observational, retrospective studies with the purpose of identifying harmful exposures (e.g., case-control studies).
- Observational, prospective studies with the purpose of identifying harmful exposures (e.g., cohort studies, systematic reviews, meta- analyses).
- Interventional, prospective studies with the purpose of preventing patients from developing a condition (e.g., case studies, case series, control trials, RCTs, cohort studies).
- Observational, prospective studies with the purpose of determining whether patients develop a given condition (e.g., case studies, case series, cohort studies, systematic reviews, meta-analyses).
Side Effects and Complications
An adverse event (AE) becomes an SAE under the following circumstances:
- Death
- Life-threatening circumstances
- Hospitalization
- Disability or permanent change
- Congenital anomaly/birth defect
- Required intervention to prevent permanent impairment or damage
- Other serious events that may jeopardize the patient or that may require medical or surgical intervention (treatment) to prevent one of the other outcomes.
Interactions
According to the Joint Commission, medication reconciliationis:
[T]he processes of comparing a patient’s medication orders to all the medications that the patient has been taking. This reconciliation is done to avoid medication errors such as omissions, duplications, dosing errors, or drug interactions [emphasis added]. It should be done at every transition of care in which new medications are ordered or existing orders are rewritten. Transitions in care include changes in setting, service, practitioner, or level of care. This process comprises five steps: (1) develop a list of current medications; (2) develop a list of medications to be prescribed; (3) compare the medications on the two lists; (4) make clinical decisions based on the comparison; and (5) communicate the new list to appropriate caregivers and to the patient.
BIOSTATISTICS IN TREATMENT, HARM, AND PREVENTION Relative Risk
Relative risk - the event rate in one group divided by the event rate in the other group.
- Also referred to as the risk ratio (RR).
The rule for interpreting the RR is as follows:
- RR > 1.0: The risk of the outcome of interest is increased for one group.
- RR < 1.0: The risk of the outcome of interest is decreased for one group.
- RR = 1.0: The risk of the outcome of interest is equal between groups.
Number Needed to Treat, Number Needed to Harm, and Number Needed to Screen
3 additional statistics that simplify the results of treatment, harm, and prevention studies are:
- number needed to treat (NNT)
- number needed to harm (NNH)
- number needed to screen (NNS)
- NNT: “The number of persons needed to be treated, on average, to prevent one more event.”11 The formula for NNT is 1/ARR.
- NNH: “The number of persons needed to be treated, on average, to produce one more adverse event.”11 The formula for NNH is 1/ARI. ARI is used because the risk of adverse events is increased, rather than reduced.
- NNS: “The average number of persons who must undergo a screening test and the ensuing diagnostic and therapeutic procedures in order to prevent one case of the disease of interest.”11 The formula for NNS is the same as for NNT: 1/ARR.
Chapter 11 Meta-Synthesis
Sandelowski and Barroso outlined the process for conducting a meta-synthesis:
- Establish the purpose of the meta-synthesis
- Locate relevant qualitative studies
- Determine the quality of the research reports
- Compare the research reports and categorize the findings
- Synthesize the findings into a new interpretation of the phenomenon
Table 11–2 Four Aspects of Determining the Trustworthiness of a Quantitative Study
Aspect of the Study Question to Ask
Internal validity Did the study accurately measure what it intended to measure? External validity Can the results be generalized to a population or to a real-life context? Reliability Were the data measured consistently?
Objectivity Was the conduct of the study unbiased?
Select an Action
Table 11–9 SWOT Analysis_
Positive Limitation
Personal Strengths Personal Weaknesses
Knowledge to perform this action Lack of knowledge to perform this action
Skills to perform this action Lack of skills to perform this action
Values to perform this action Lack of values to perform this action
Experience and expertise Lack of experience and expertise
Any other items that will have a positive influence on performing the action
Any other items that will be limit the performance of this action
Outside Opportunities Outside Threats
(related to the patient or community and
healthcare setting)
(related to the patient or community and
healthcare setting)
Knowledge to perform this action Lack of knowledge to perform this action Skills or resources to perform this action Lack of skills or resources for this action Values to perform this action Lack of values to perform this action
Ability to pay for care (e.g., insurance) Inability to pay for care (e.g., no insurance)
Presence of support system Lack of support system
Any other items that will have a positive influence
on performing the action
Any other items that will be limit the
performance of this action
IMPLEMENTATION AND EVALUATION
Figure 11–2 Patient-Centered Evidence-Based Model
Table 11–10 Reflection Questions
- What have I learned as an individual from this experience? What have we learned as a collaborative interprofessional team?
- How will my future actions change based on this experience? How will our collaborative interprofessional team’s actions change?
- What more do I need to learn related to …? What more does our collaborative interprofessional team need to learn related to …?
° Recognizing a need for information
° Establishing a purpose for the EBP
° Formulating a focused question
° Identifying target resources
° Performing a search
° Organizing findings
° Appraising trustworthiness of evidence
° Assessing the relevance of evidence
° Selecting an action
° Implementing and evaluating the action
0
989